Measured, not asserted.
Forecast every month.Measure every miss.Review every change.
SCIMIN Demand Forecasting reads your sales history and forecasts every level of your network. Then it shows how close each forecast came.
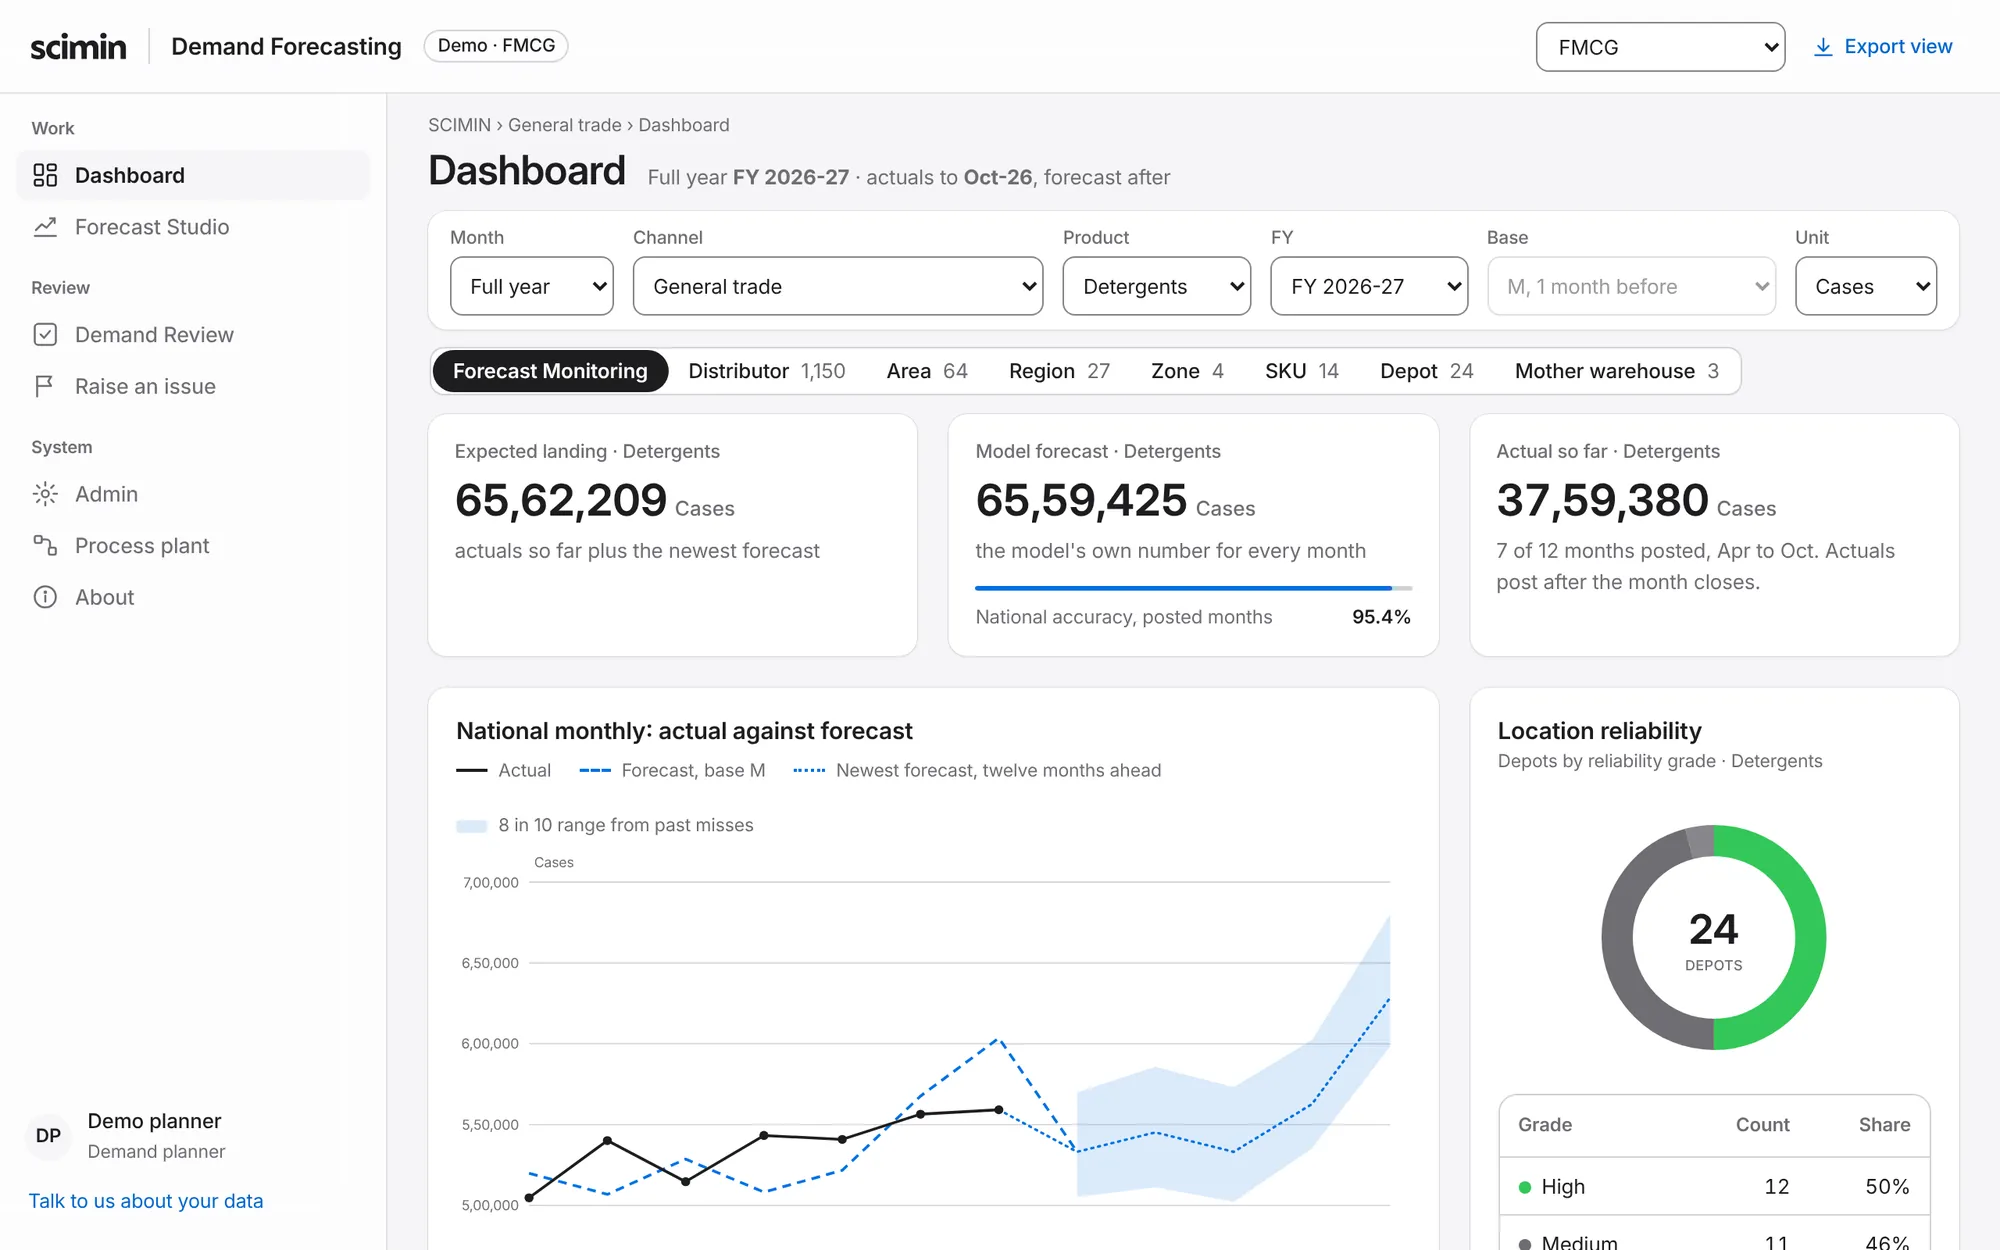
Every level adds up.
Each forecast starts at the smallest unit you sell through. Areas, regions and depots are sums of the same numbers.
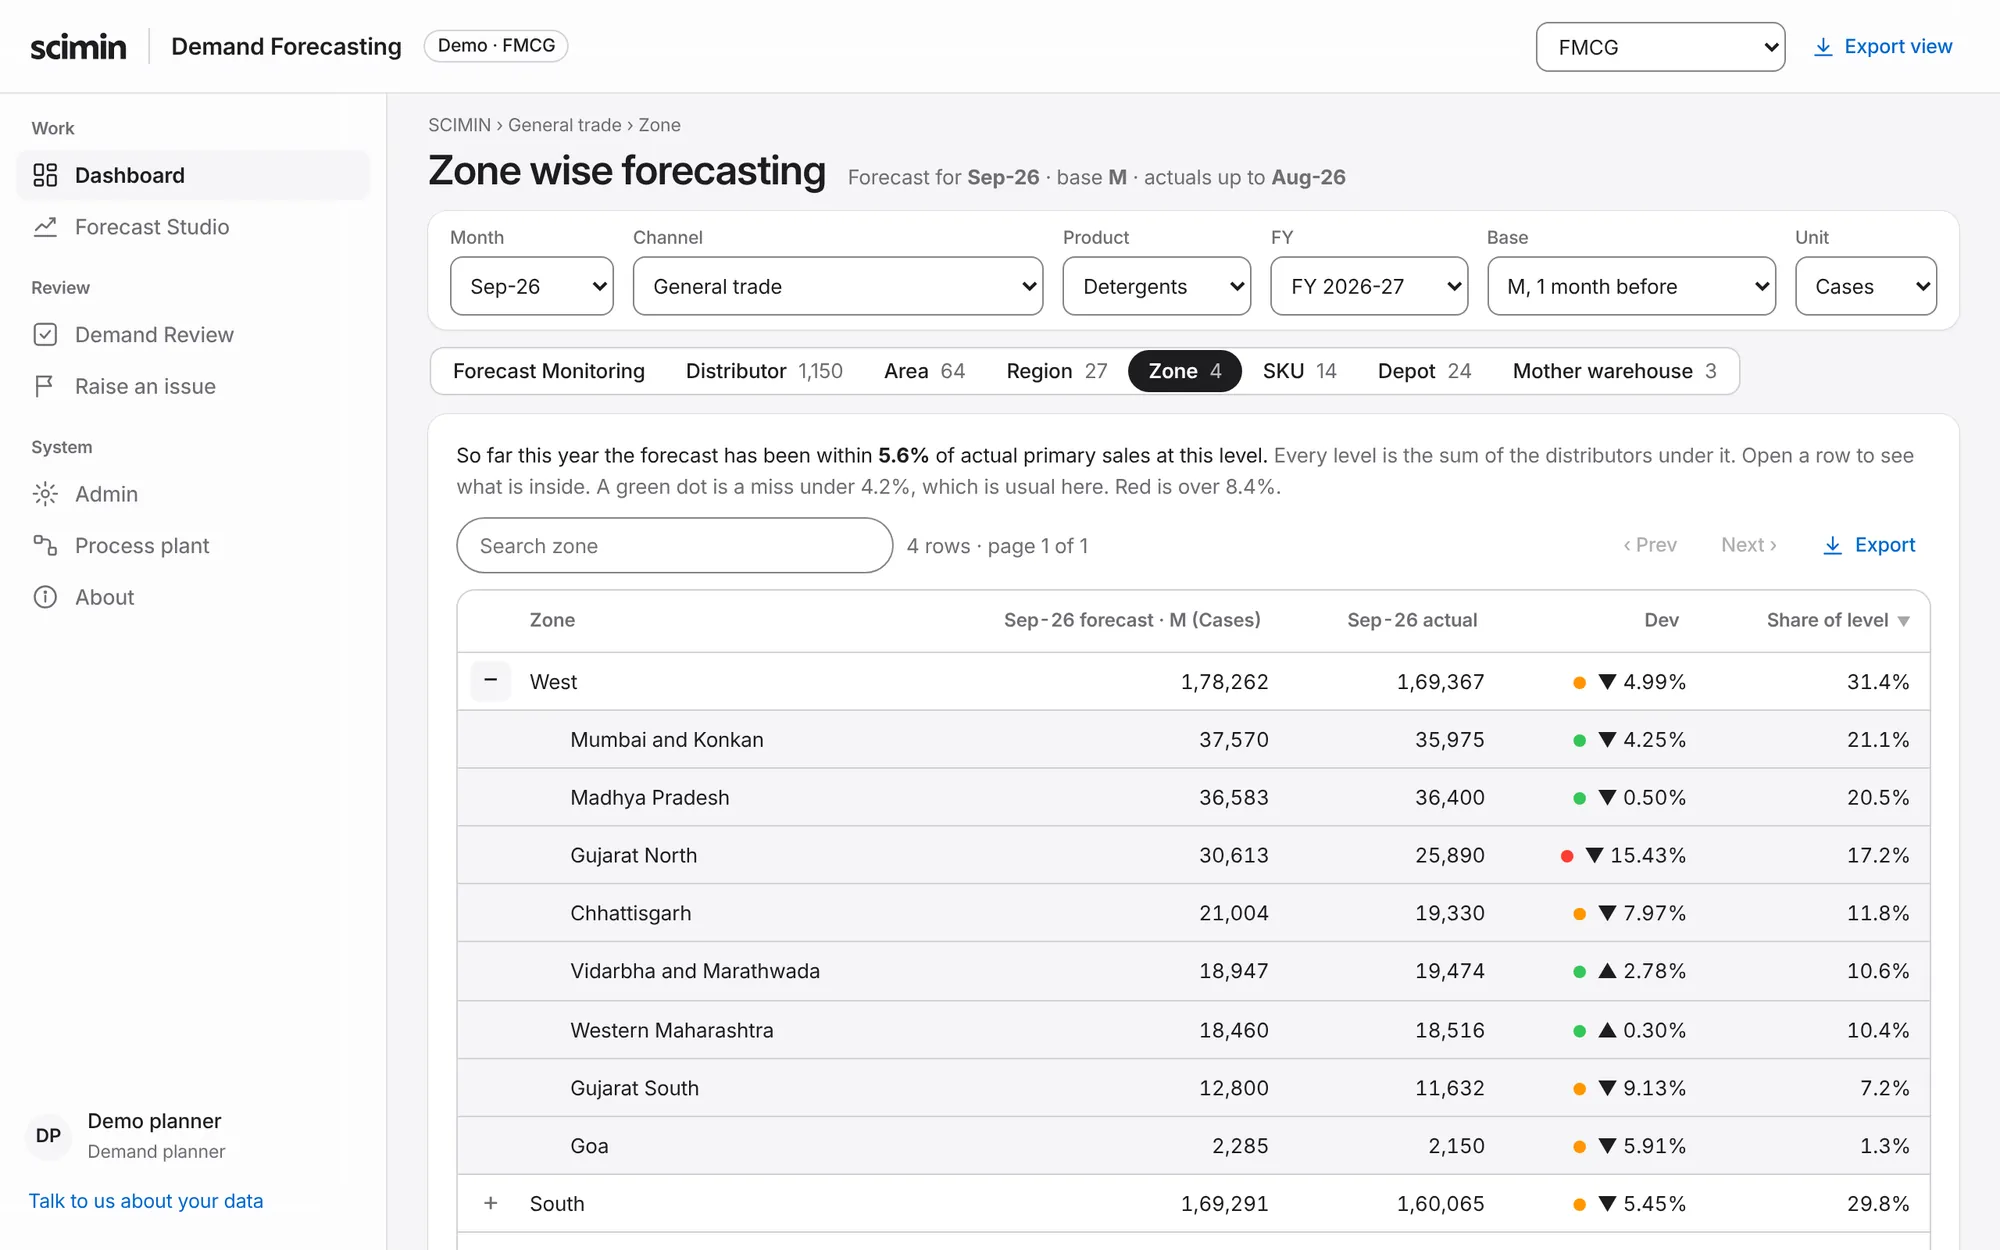
It tells you when it is wrong.
Every forecast is scored against the actual, on months the model had not seen.
- Against a benchmarkEach level sits beside the simplest forecast there is: the same month last year.
- At every levelThe miss is measured on each unit and added up, so one high forecast cannot hide a low one.
- With its leanThe app says whether it runs high or low, and flags a level that keeps missing one way.
The review is scored too.
Sales, regions and planners each enter their number. Once the month posts, the app shows which step moved the forecast closer.

Set up for your industry.
The same app in your words, your hierarchy, your units and your calendar. Pick yours and the demo opens in a new tab.
FMCG demo, opens in a new tabE-commerce demo, opens in a new tabAuto spares demo, opens in a new tabPharma demo, opens in a new tabGrocery and fresh demo, opens in a new tabCement demo, opens in a new tabFood and beverage demo, opens in a new tabElectronics demo, opens in a new tabFashion demo, opens in a new tabIndustrial MRO demo, opens in a new tabChemicals demo, opens in a new tabAgri-inputs demo, opens in a new tab
Start with your own history.
Send two years of monthly sales. We set up your hierarchy and calendar, and you see your own forecast, measured.