A forecast you can check.
Here is how each number is made, how it is measured and what happens when people change it.
One number for sales and supply.
The sales tree and the supply tree do not nest. The app keeps both, and each adds up to the same total.
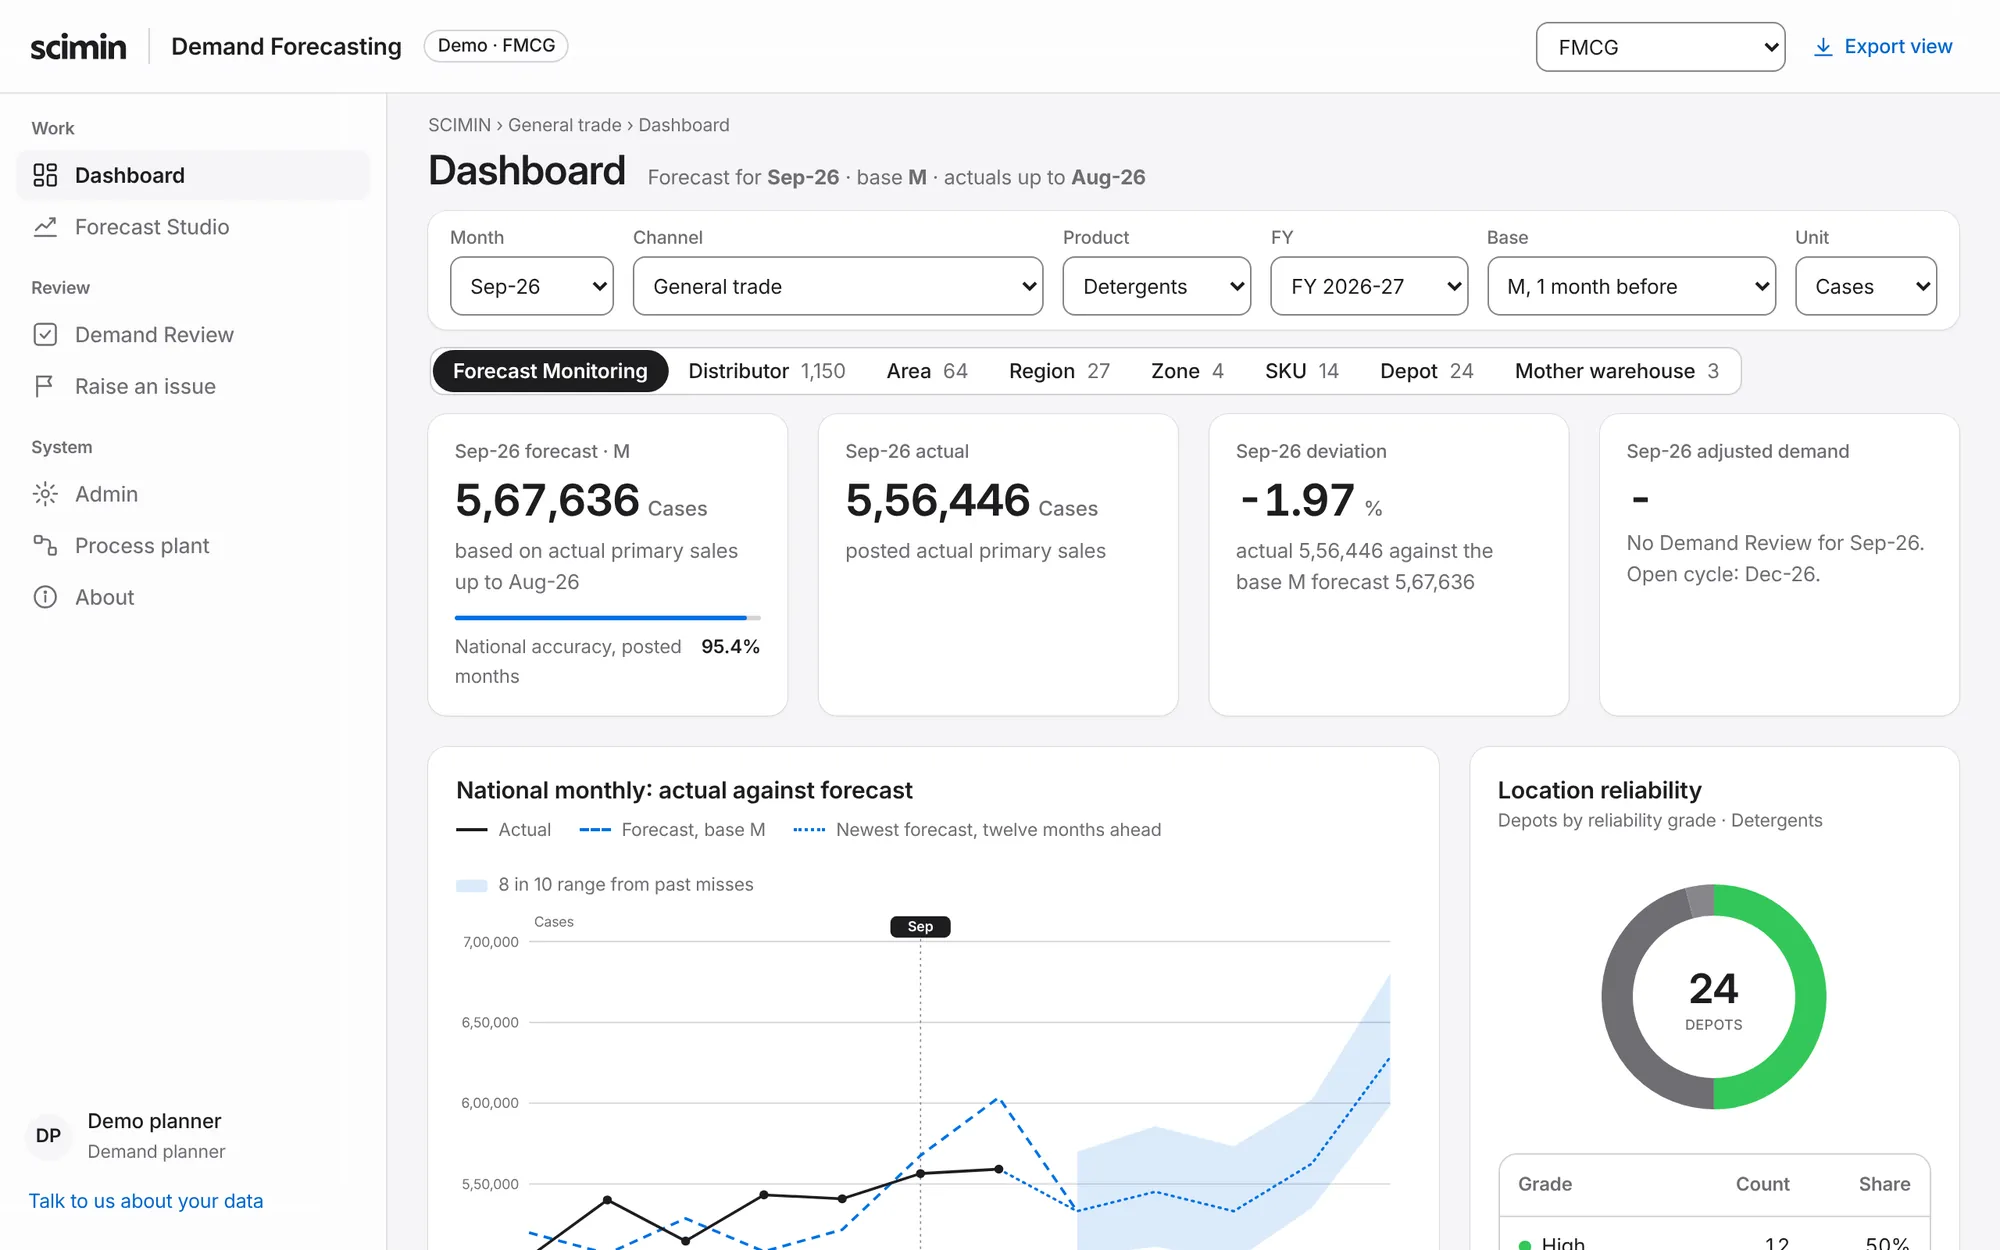
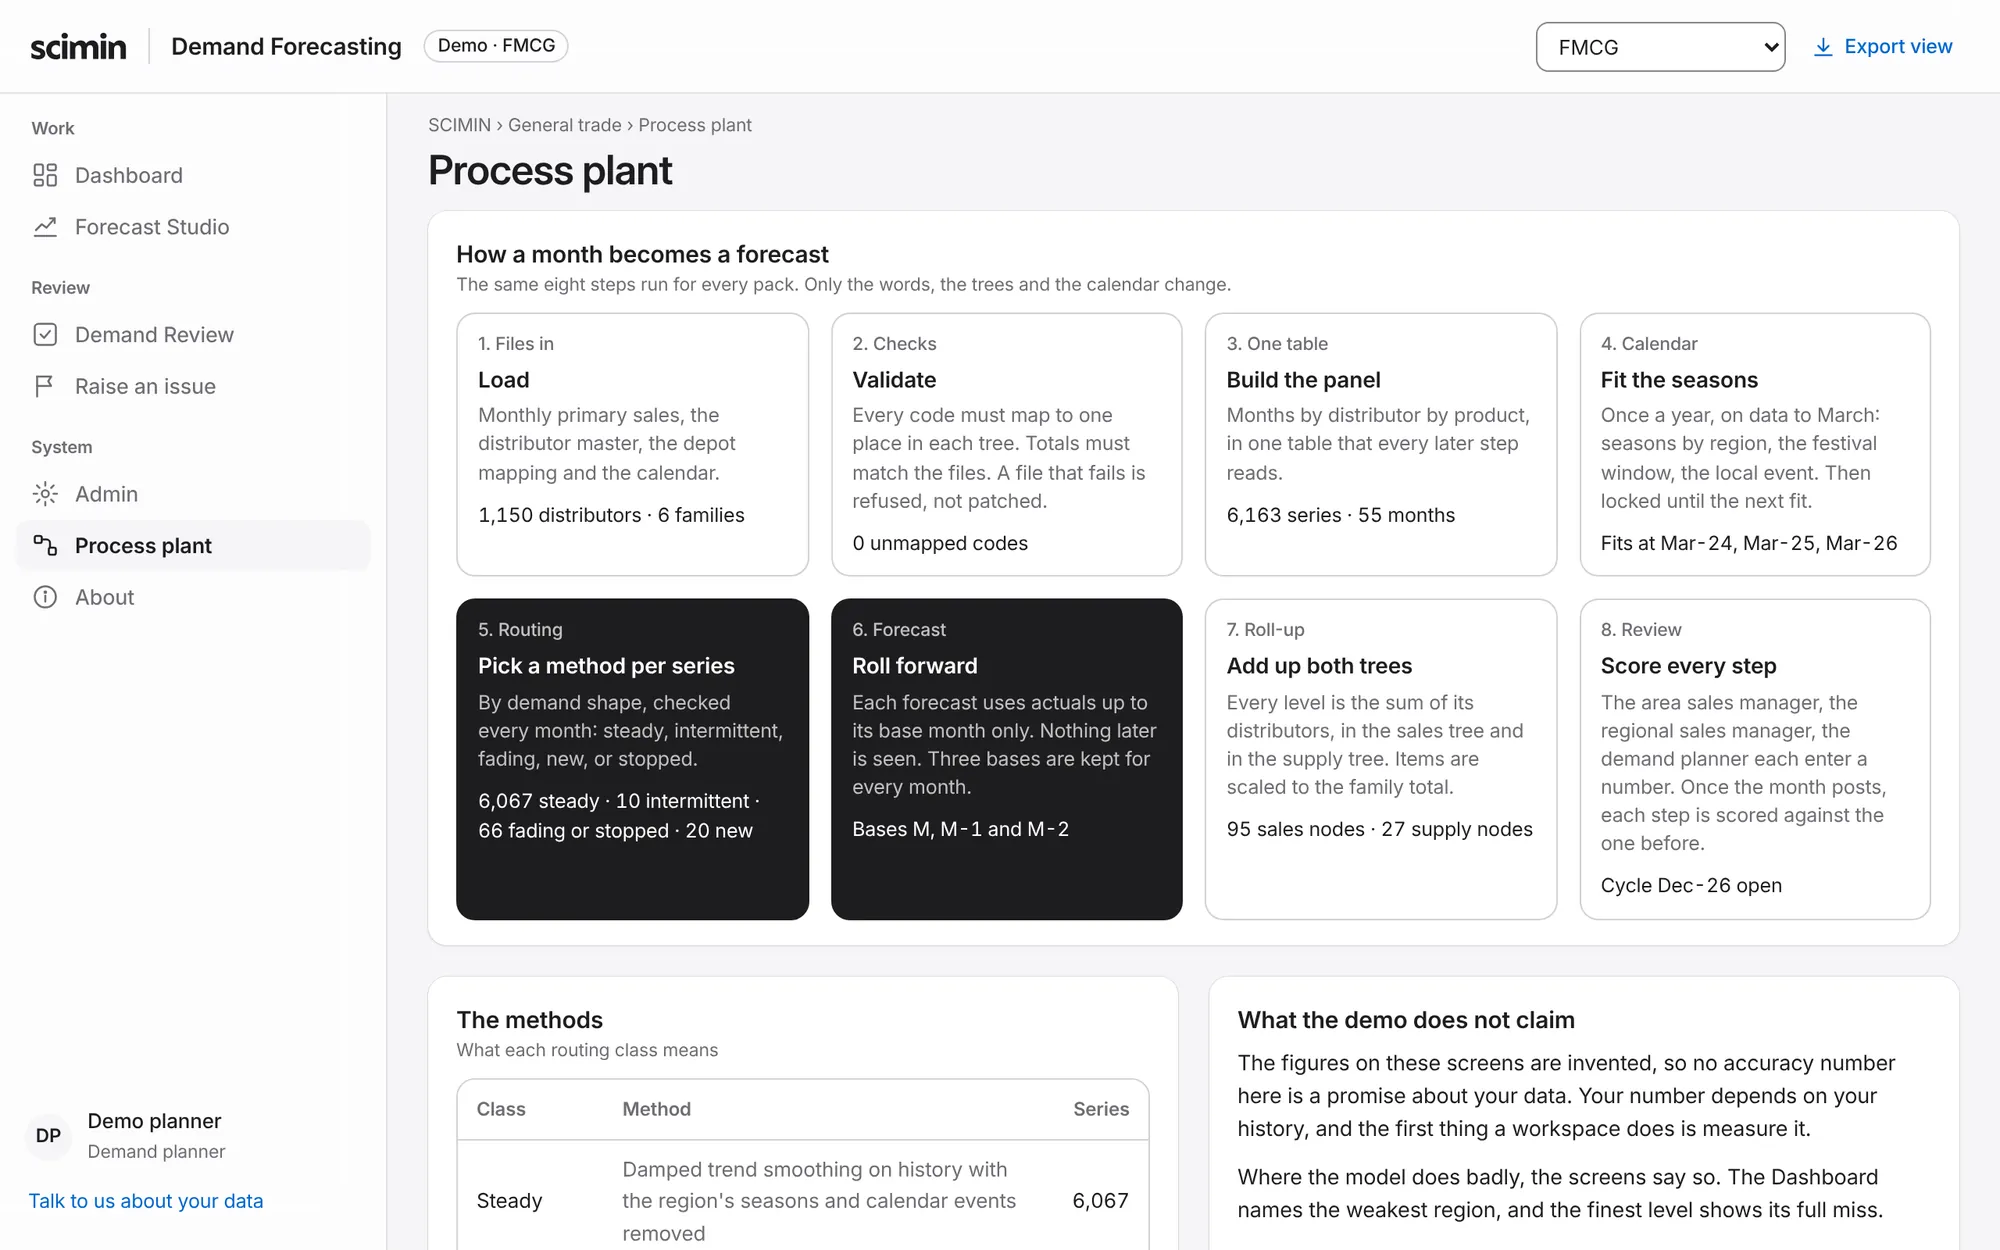
Each series gets the method it needs.
A part that sells twice a year is not forecast like one that sells daily. The app checks every series each month.
- SteadyDamped trend smoothing, after the region's seasons and calendar events are taken out.
- IntermittentSBA, which is Croston's method with the Syntetos and Boylan correction.
- FadingTSB, the chance of a sale times its size, when sales have stopped for six months.
- NewThe ramp of those that opened earlier, scaled to this one.
- StoppedZero, after twelve months with no sale.
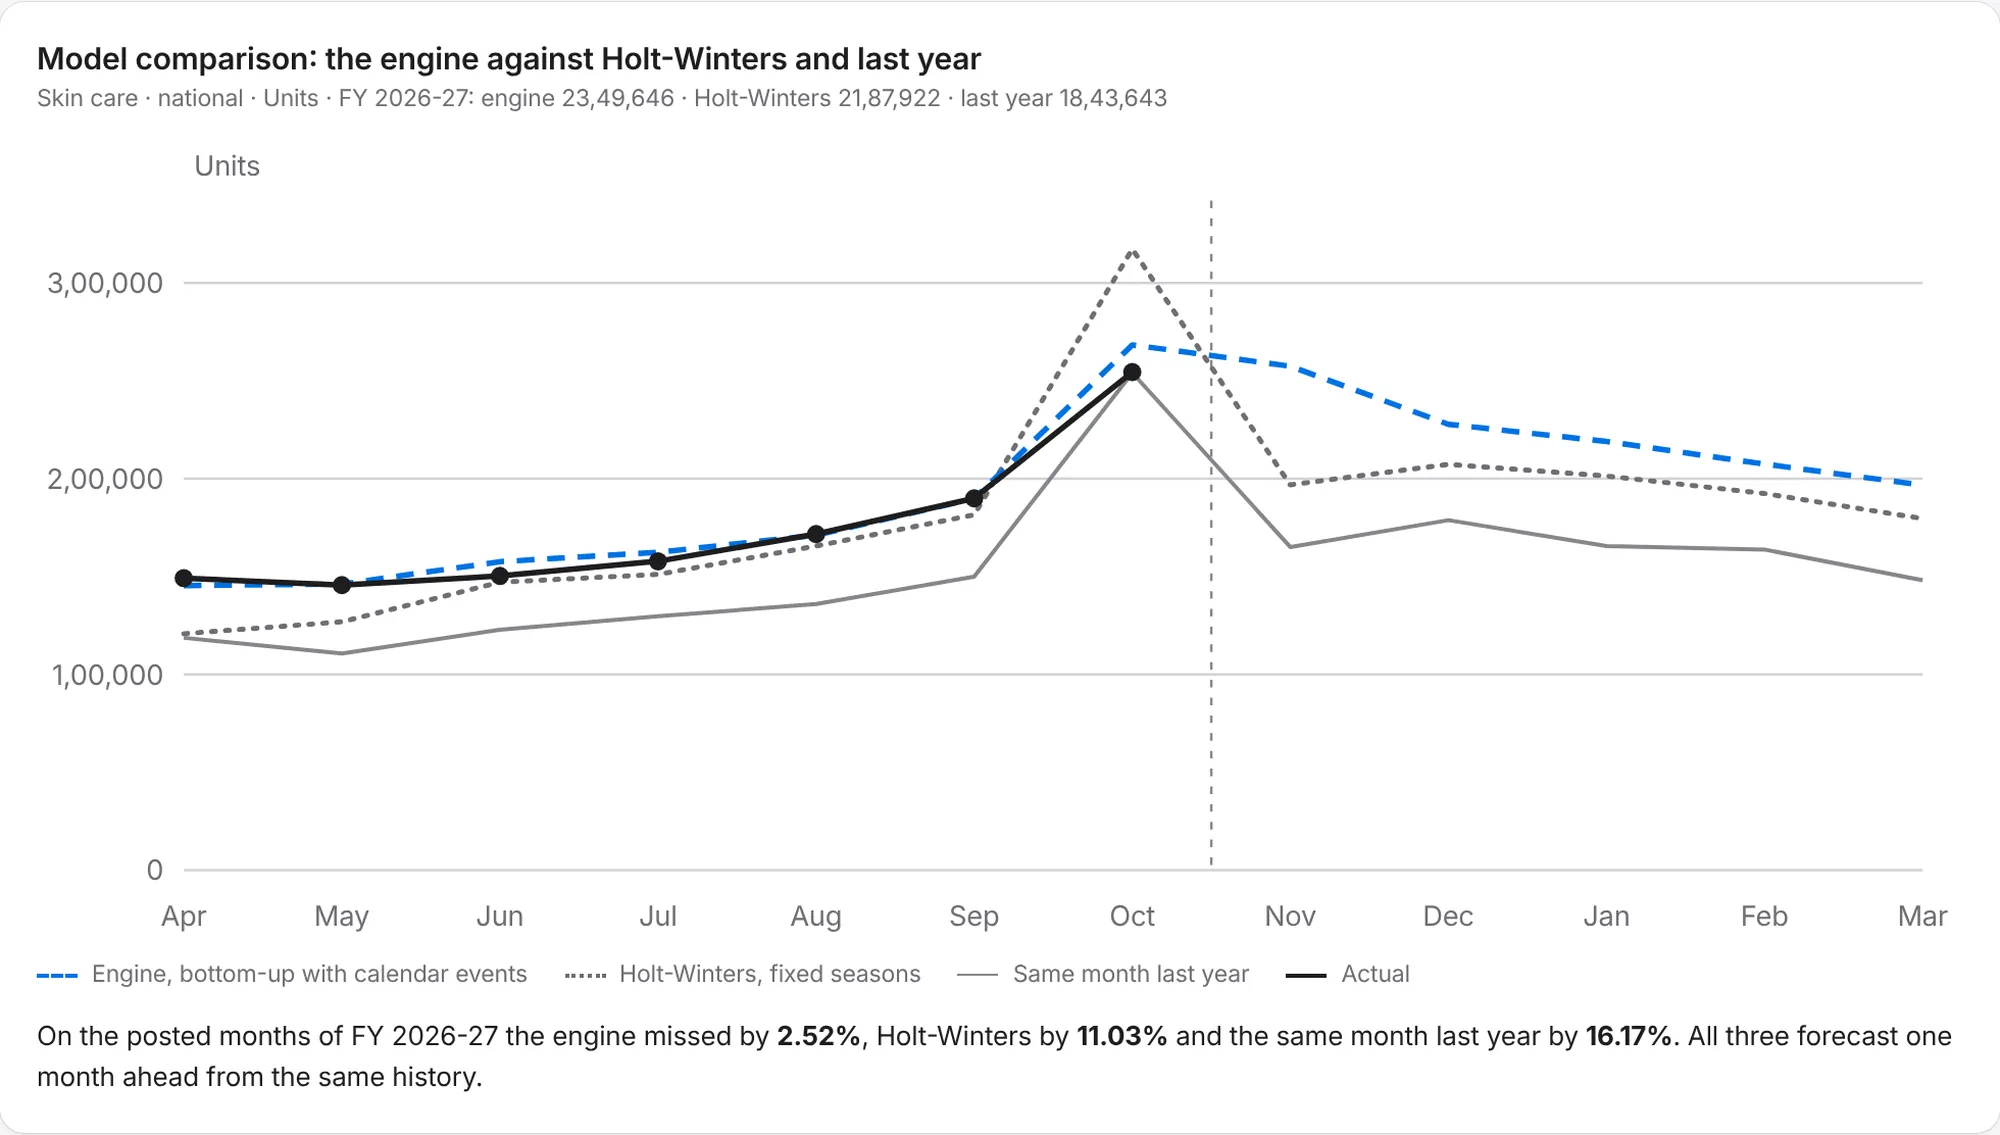
Measured on months it had not seen.
Every forecast uses actuals up to its base month only. Three bases are kept, so you can see how the forecast firmed up.
- Base MMade when the month before has closed.
- Base M-1Made one month earlier.
- Base M-2Made two months earlier.
The calendar moves. The forecast follows.
Diwali shifts between October and November. A monsoon or a shutdown has its own date. Each is a dated event, not a month.
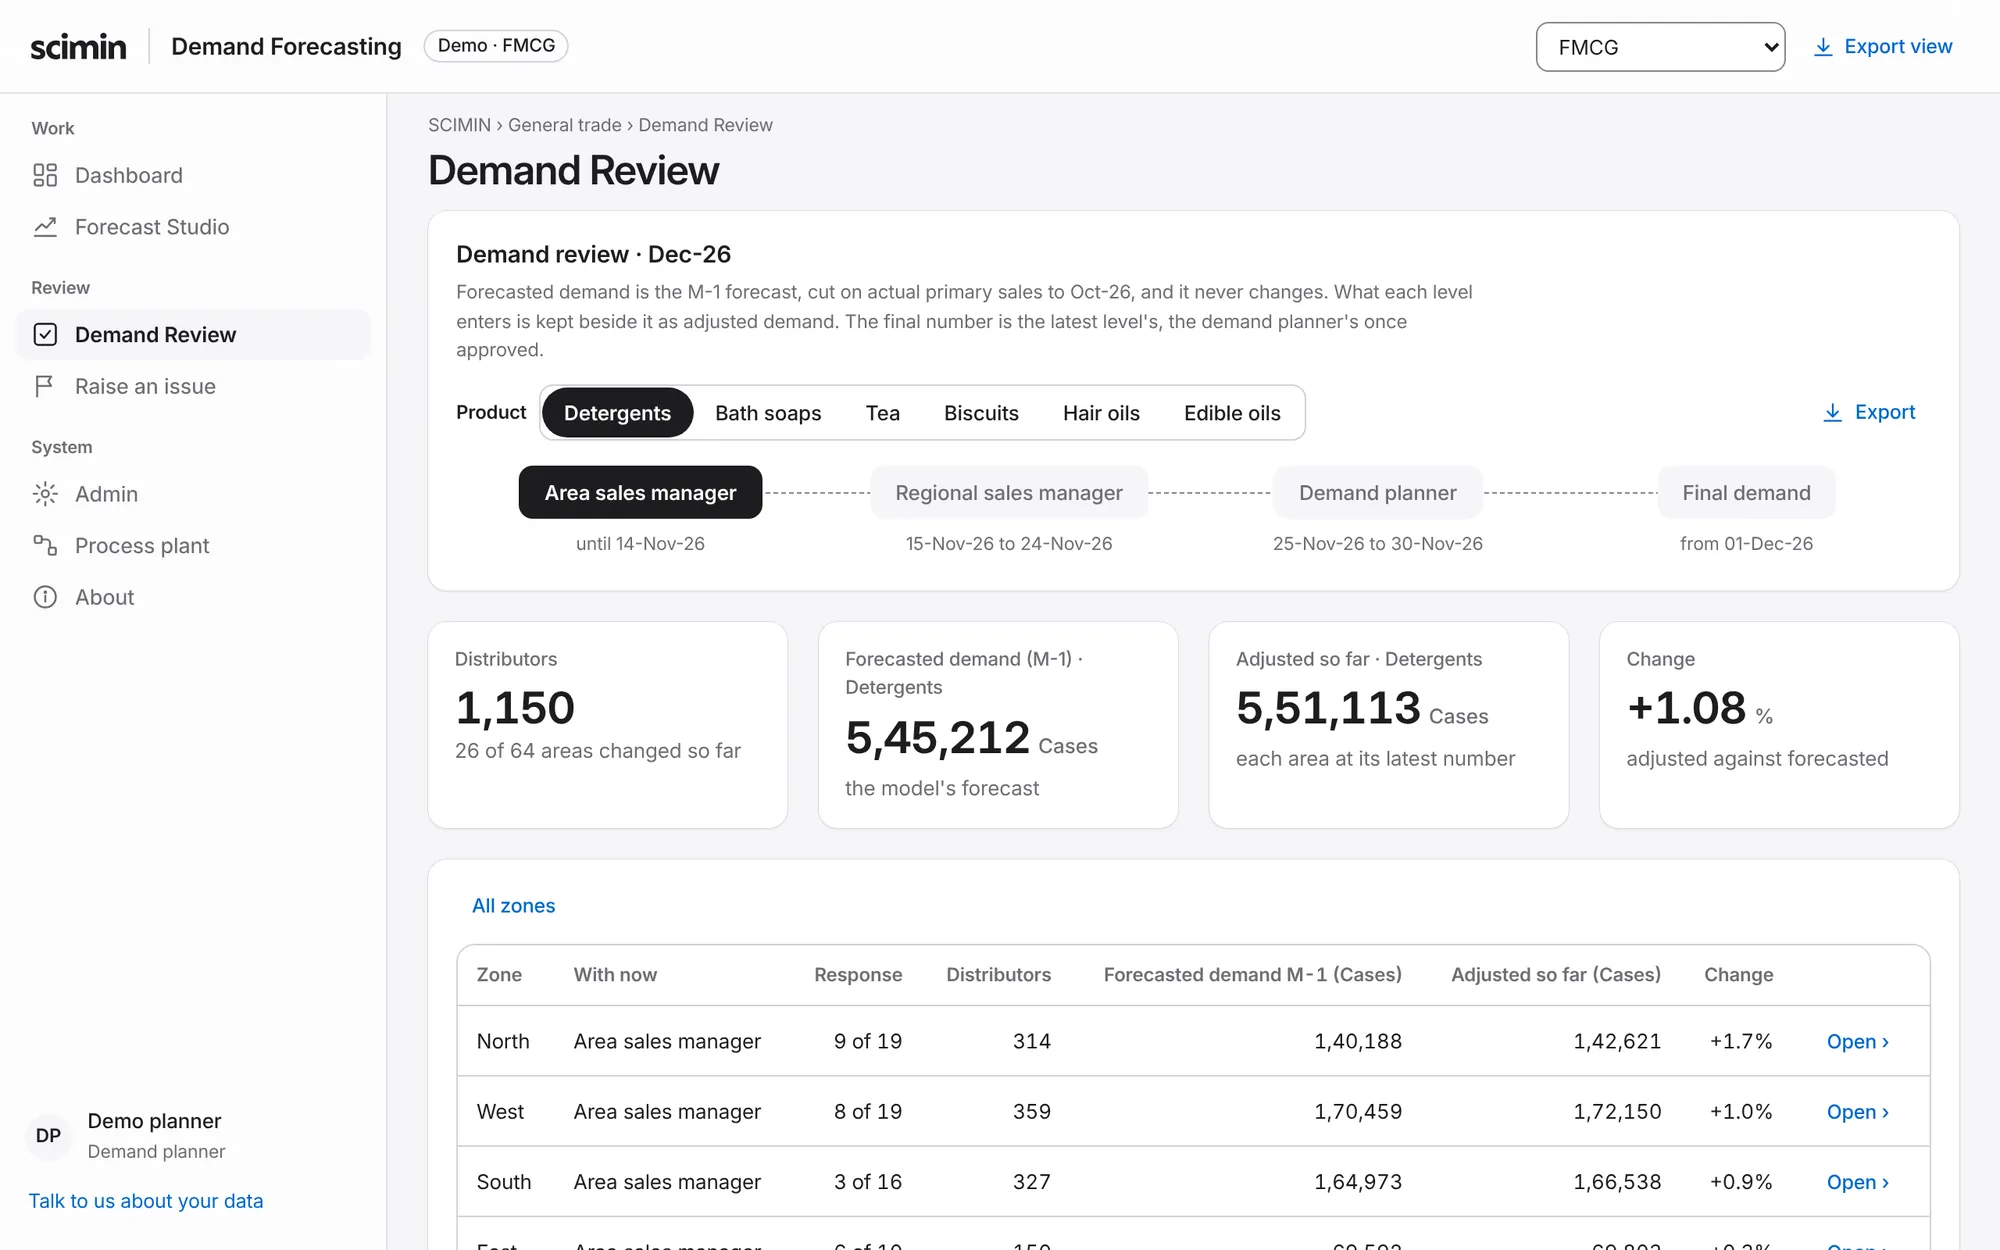
A review with a scoreboard.
Each level enters its number beside the model's. When the month posts, every step is scored against the one before it.
Your words, your units, your files.
A pack holds the names of your levels, your units and their conversions, and your calendar. Tables export to a spreadsheet.
- WordsDistributor, stockist, dealer or store. Zone, branch or state. The screens use your names.
- UnitsCases and tonnes, tonnes and bags, units and value. Each product carries its own conversion.
- FilesMonthly sales, a master of who you sell through, and a mapping to your supply points.
See it on your industry.
Twelve demos run on invented data, one for each industry.