Demand forecasting for e-commerce brands.
Forecast orders by channel, city and SKU. Sale events move every year, and the forecast moves with them.
The app, in your trade's words.
This demo carries 520 pincode clusters and 55 months of invented history.
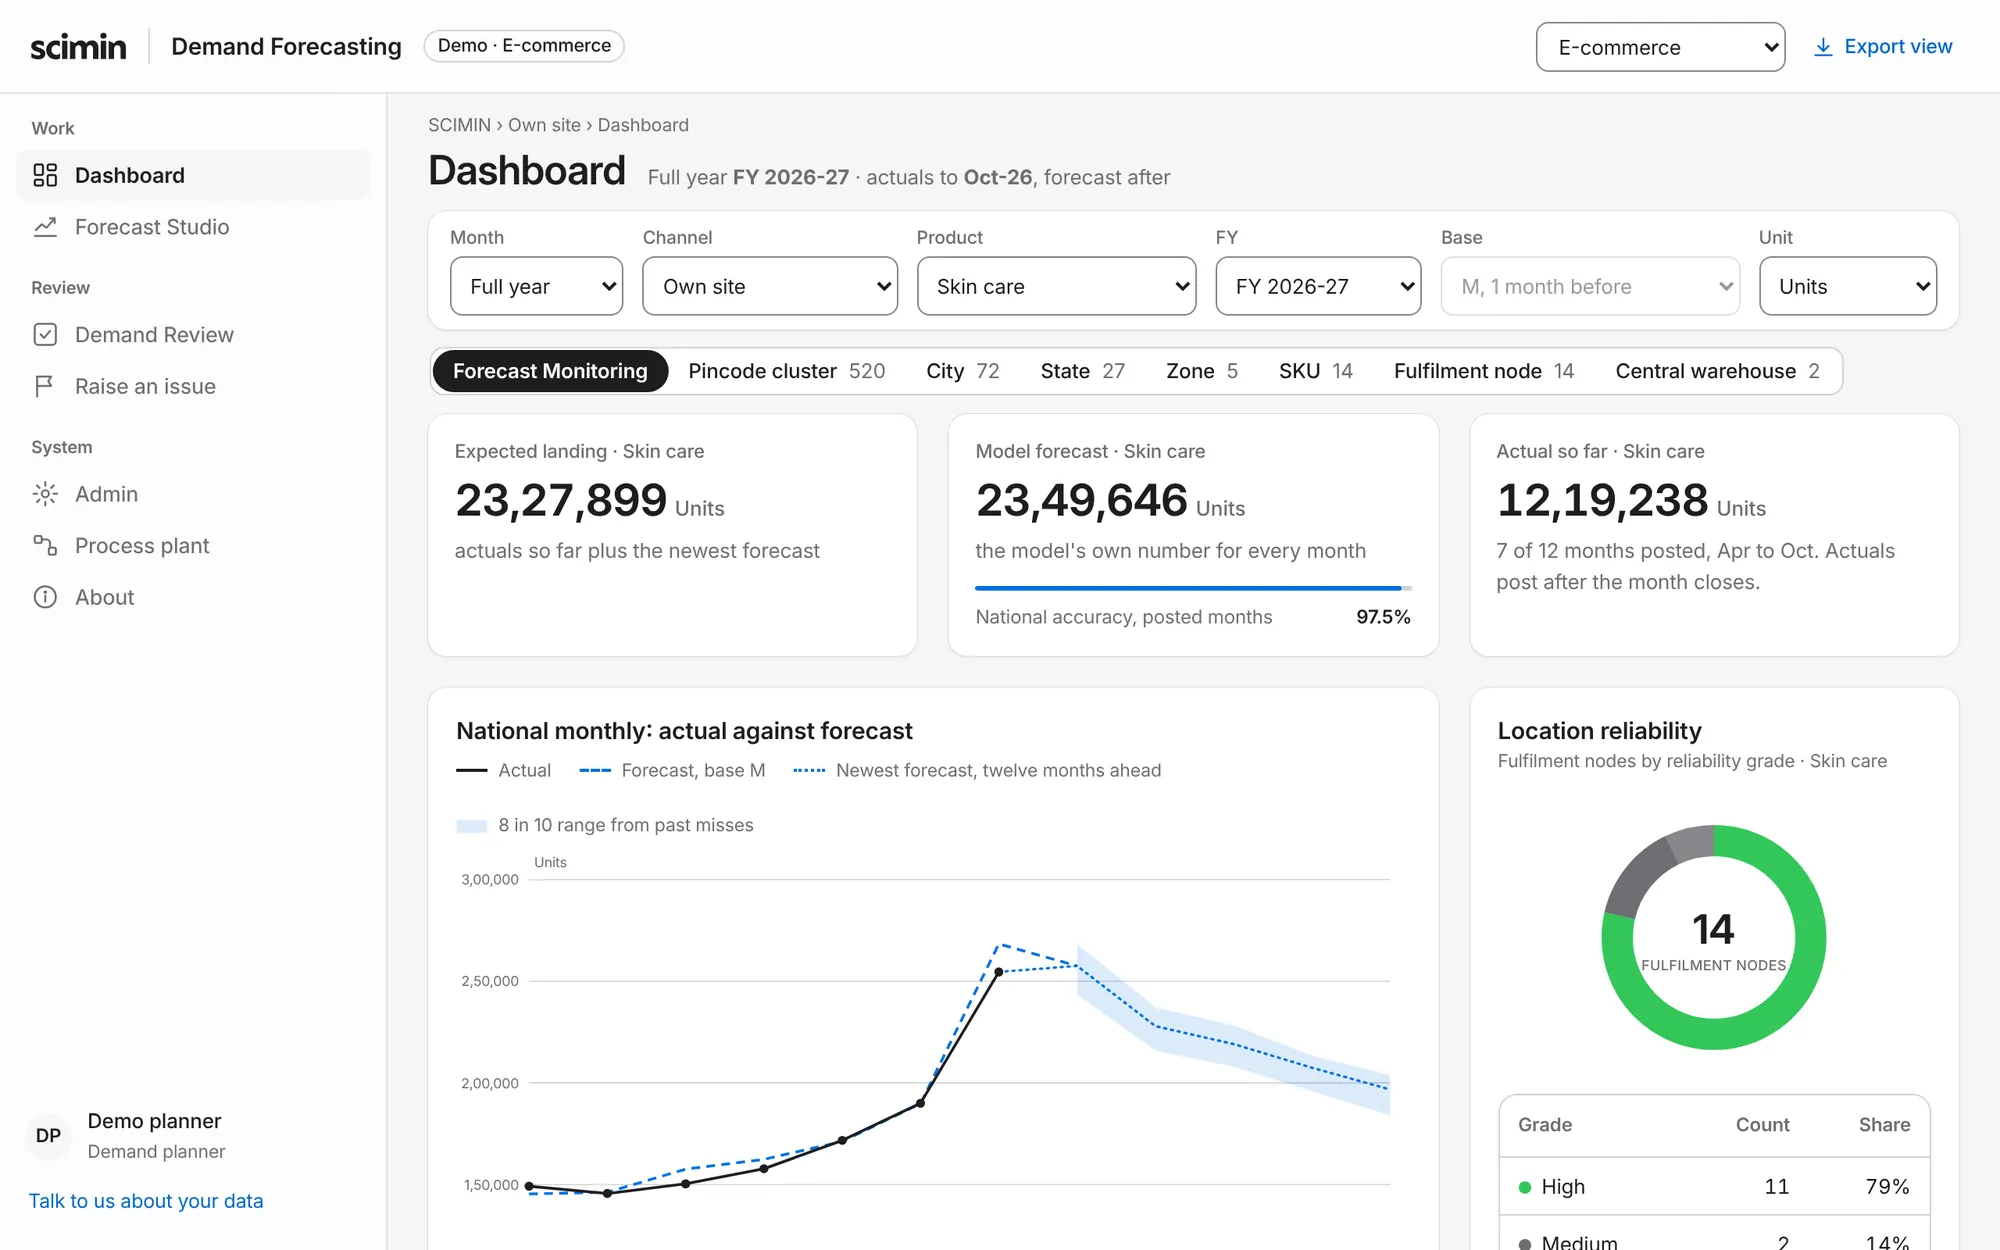
What the pack sets.
- Who plans
- Demand planner
- Channel
- Own site, Marketplaces, Quick commerce
- Sales tree
- Zone, State, City and Pincode cluster or Marketplace FC or City DC
- Supply tree
- Central warehouse and Fulfilment node
- Catalogue
- SKUs in six families, such as Skin care, Hair care, Supplements
- Units
- Units and Net units
- Calendar
- A festival window that moves with Diwali.
- Review steps
- Growth team, then Demand planner, then Founder
- Output
- Weekly replenishment and channel allocation sheet
What is hard here.
- Demand is partly bought. A sale event or an ad push moves the month more than the season does.
- The festival sale window shifts between October and November each year.
- Gross orders are not net units. Returns come back weeks later, and the share differs by category.
Try this in the demo.
- Switch the unit to net units.
- Open the Forecast Studio and look at October and November.
- Pick Quick commerce and open one city.